 --
-- New article hailed as "proof" of climate change
It does support the notion that CO2 has some effect but how much? The answer to that lies in the term "incredibly precise" below. They had to use research instrumentation and methods that could detect incredibly small changes. And that the effects of CO2 are incredibly small is just what skeptics have been saying! The work vindicates skeptics, if anything.
Beware of the sentence below "This increase is about ten percent of the trend from all sources of infrared energy". It does NOT say "This increase is about ten percent of all sources of infrared energy". Ten percent of a TREND was a tiny amount.
So I am giving this study a big tick. If I were in a critical mood I might mention that it critically involves the assumption that correlation is causation but I am inclined to be big-souled about that on this occasion
I add the journal abstract below
Scientists have witnessed carbon dioxide trapping heat in the atmosphere above the United States, showing human-made climate change 'in the wild' for the first time.
A new study in the journal Nature demonstrates in real-time field measurements what scientists already knew from basic physics, lab tests, numerous simulations, temperature records and dozens of other climatic indicators.
They say it confirms the science of climate change and the amount of heat-trapping previously blamed on carbon dioxide. 'We see, for the first time in the field, the amplification of the greenhouse effect because there's more CO2 in the atmosphere to absorb what the Earth emits in response to incoming solar radiation,' said Daniel Feldman, a scientist in Berkeley Lab's Earth Sciences Division and lead author of the Nature paper.
'Numerous studies show rising atmospheric CO2 concentrations, but our study provides the critical link between those concentrations and the addition of energy to the system, or the greenhouse effect,' Feldman adds. He said no one before had quite looked in the atmosphere for this type of specific proof of climate change.
The scientists used incredibly precise spectroscopic instruments operated by the Atmospheric Radiation Measurement (ARM) Climate Research Facility, a DOE Office of Science User Facility.
These instruments, located at ARM research sites in Oklahoma and Alaska, measure thermal infrared energy that travels down through the atmosphere to the surface. They can detect the unique spectral signature of infrared energy from CO2.
Other instruments at the two locations detect the unique signatures of phenomena that can also emit infrared energy, such as clouds and water vapor.
The result is two time-series from two very different locations. Each series spans from 2000 to the end of 2010, and includes 3300 measurements from Alaska and 8300 measurements from Oklahoma obtained on a near-daily basis.
Both series showed the same trend: atmospheric CO2 emitted an increasing amount of infrared energy, to the tune of 0.2 Watts per square meter per decade. This increase is about ten percent of the trend from all sources of infrared energy such as clouds and water vapor.
Based on an analysis of data from the National Oceanic and Atmospheric Administration’s CarbonTracker system, the scientists linked this upswing in CO2-attributed radiative forcing to fossil fuel emissions and fires.
The measurements also enabled the scientists to detect, for the first time, the influence of photosynthesis on the balance of energy at the surface.
They found that CO2-attributed radiative forcing dipped in the spring as flourishing photosynthetic activity pulled more of the greenhouse gas from the air....
The study is good technical work, said climate scientist Andrew Dessler of Texas A&M University, but it is expected — sort of like confirming gravity with a falling rock.
More HERE
Observational determination of surface radiative forcing by CO2 from 2000 to 2010
By D. R. Feldman et al.
The climatic impact of CO2 and other greenhouse gases is usually quantified in terms of radiative forcing1, calculated as the difference between estimates of the Earth’s radiation field from pre-industrial and present-day concentrations of these gases. Radiative transfer models calculate that the increase in CO2 since 1750 corresponds to a global annual-mean radiative forcing at the tropopause of 1.82 ± 0.19 W m−2 (ref. 2). However, despite widespread scientific discussion and modelling of the climate impacts of well-mixed greenhouse gases, there is little direct observational evidence of the radiative impact of increasing atmospheric CO2. Here we present observationally based evidence of clear-sky CO2 surface radiative forcing that is directly attributable to the increase, between 2000 and 2010, of 22 parts per million atmospheric CO2. The time series of this forcing at the two locations—the Southern Great Plains and the North Slope of Alaska —are derived from Atmospheric Emitted Radiance Interferometer spectra3 together with ancillary measurements and thoroughly corroborated radiative transfer calculations4. The time series both show statistically significant trends of 0.2 W m−2 per decade (with respective uncertainties of ±0.06 W m−2 per decade and ±0.07 W m−2 per decade) and have seasonal ranges of 0.1–0.2 W m−2. This is approximately ten per cent of the trend in downwelling longwave radiation5, 6, 7. These results confirm theoretical predictions of the atmospheric greenhouse effect due to anthropogenic emissions, and provide empirical evidence of how rising CO2 levels, mediated by temporal variations due to photosynthesis and respiration, are affecting the surface energy balance.
SOURCE
UPDATE: Rog Tallbloke Has even more fun with the above study than I did. He points out that in Alaska over the study period, the average temperature actually FELL by four degrees. So rising CO2 must cause cooling, Right?
Another point I did not mention because I saw no point in beating a dead horse concerns the graph below. It appeared with the original story.
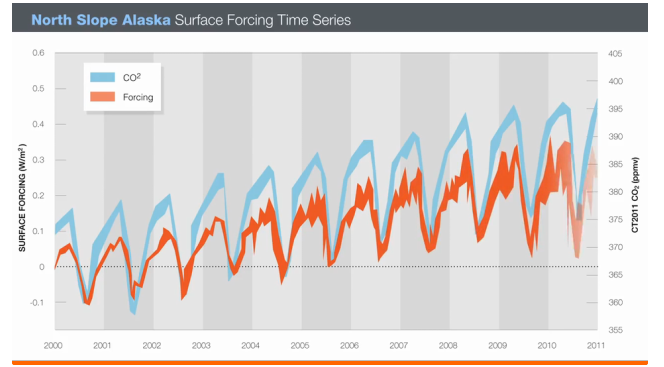
It shows two nicely matching curves, does it not? But what are the quantities being graphed? One is CO2 but the other is NOT temperature. It is a theoretically derived construct called forcing. Not so impressive.
No comments:
Post a Comment
All comments containing Chinese characters will not be published as I do not understand them